Summary
The surface under the cumulative ranking curve (SUCRA) is a metric whose score ranges from 0% to 100%. It is used in network meta-analyses (NMA) to rank how effective an intervention is compared to all the other interventions in the NMA. If an intervention has a SUCRA of 0%, then the intervention is definitely the worst of the bunch according to the NMA. If an intervention’s SUCRA is 100%, then the intervention is definitely the best according to the evidence used in the NMA.
As long as some technical assumptions hold, SUCRA values reliably rank interventions within a given NMA. As a simple example, let’s assume that an NMA assessed three treatments: A, B, and C, each with the following SUCRA values:
- A: 23%
- B: 77%
- C: 53%
Thus, we could say that B is the best treatment, followed by C, and A is the worst of the bunch.
Note that you cannot compare interventions’ SUCRA values between different NMA studies; this is only valid within a single NMA.
SUCRA is calculated as the area (or surface) under a cumulative ranking curve. Cumulative ranking curves are graphs of the probability of a treatment being at a given rank or higher.
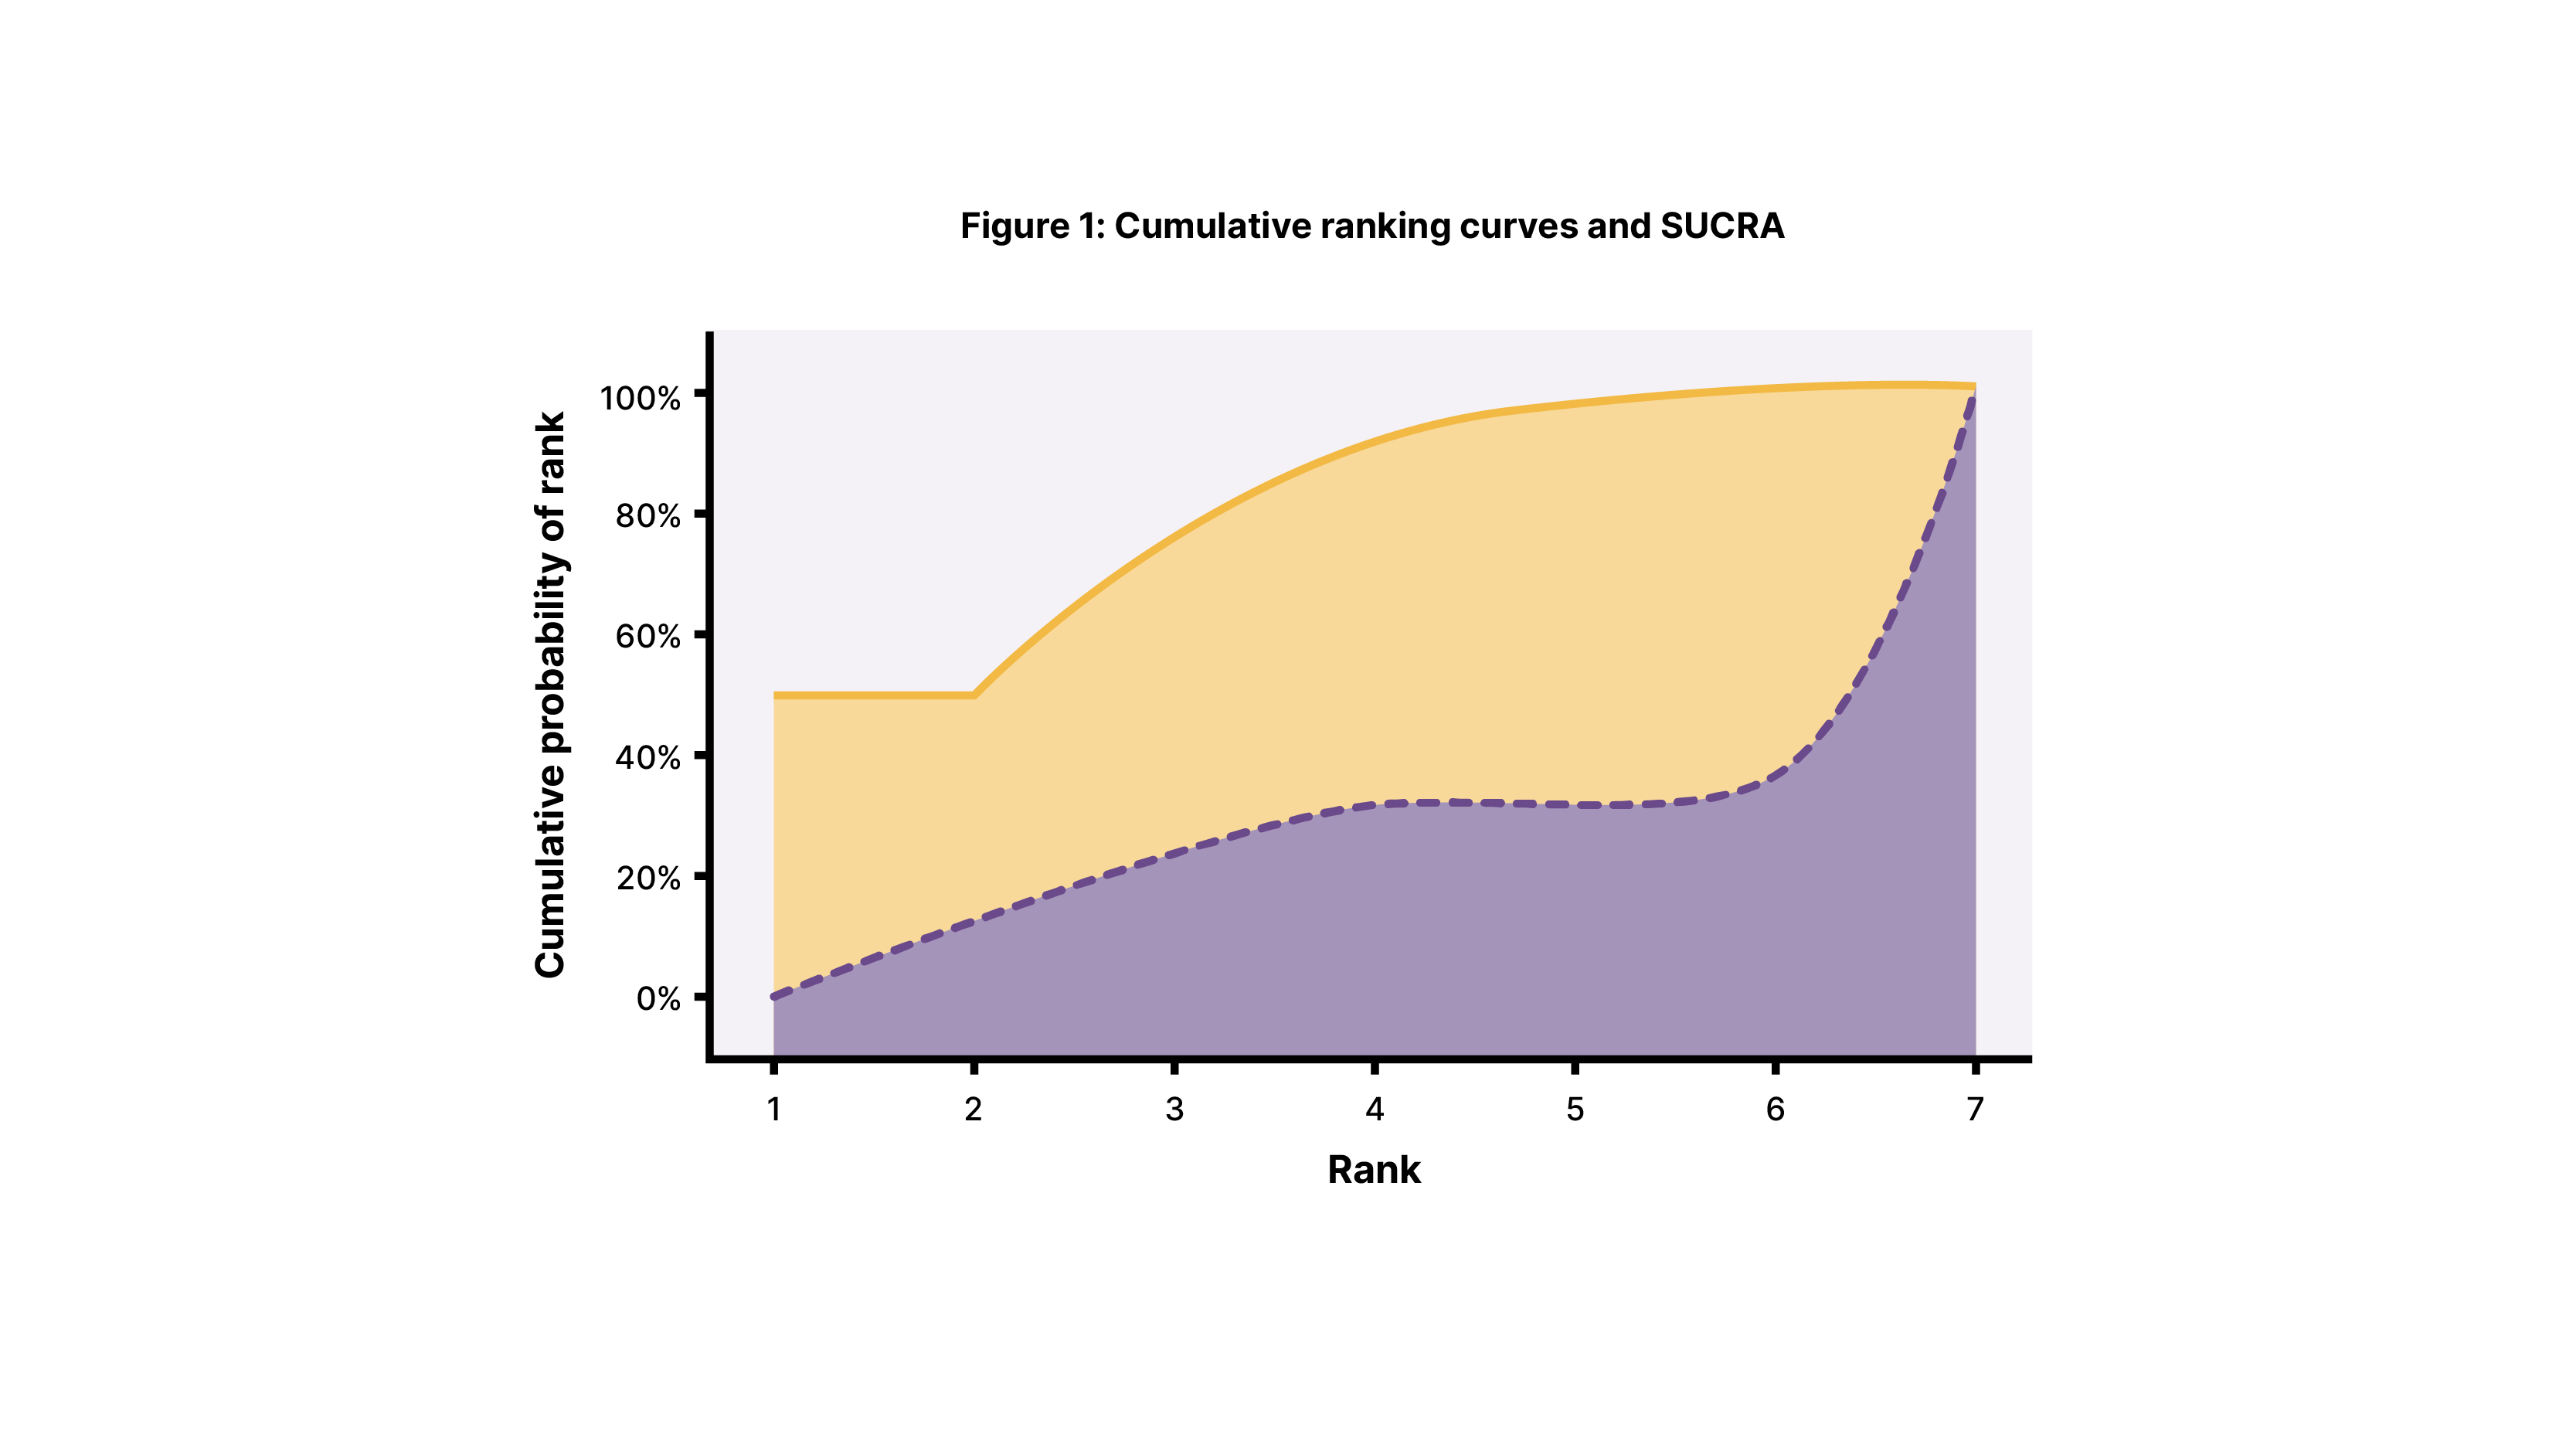
An example of two treatments’ cumulative ranking curves is shown in Figure 1. Notice that the x-axis goes from 1 to 7. There are seven total ranks, indicating that seven treatments were assessed. The dashed and solid lines represent two of the seven treatments’ cumulative ranking curves.
Looking at the solid line, you’ll notice that it starts out at a 50% probability of being ranked first among the seven treatments. For rank 2, the solid line is around 60% at rank 2. Since the curve is cumulative, the 60% at rank 2 comes from the 50% probability at rank 1, plus an additional 10% probability, for a total of around 60%. Another way of interpreting the solid curve’s value at position 2 on the x-axis is that there is around a 60% probability of the treatment being ranked number 1 or number 2.
The SUCRA value is simply the area under each curve. By inspection, you can hopefully tell that the solid line has a greater area under the curve than the dashed line does. Thus, the treatment indicated by the solid line is more likely to be superior to the one indicated by the dashed line.